
I haven’t been doing a lot of flying over the winter months. I know because for the first time ever I have been battling to keep my rental currency (which expires every 30 days).
I decided to crunch some numbers in my log book and came up with this graph which shows monthly flight hours per year.
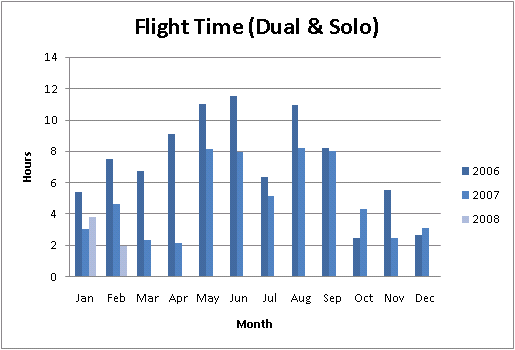
2007 As a whole was a lower year for flying with the exception of October and December, where I had done more flying than in 2006 in those months.
Looking at the graph, I now understand why I think that this winter was the worst winter ever for flying. It’s because last month (Feb 2008) was the lowest month ever for flight time.
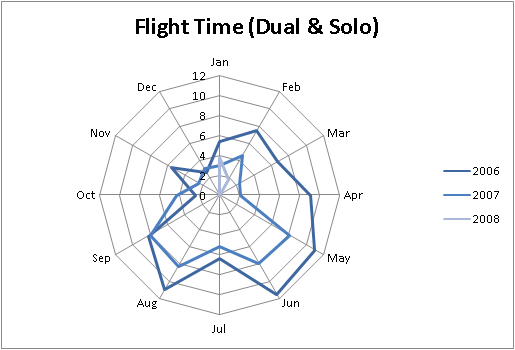
Here is the same data presented in a “radar graph”. It’s merely here to illustrate that I do most of my flying in the summer months.
I hope that I can shatter all previous months records starting this summer. Must.. get… that… commercial license!
I have just started flying and it has been a fun experience. Do send me some tips if you have.